Showcase 07 · Swarm routing
Data traffic
Phones, browsers, AI services and servers exchange data through nine nodes. Every point of light is a packet, up to 100,000 at once. They follow the shortest route, jam at bottlenecks and move over to free lines. Click a node to take it down and watch the traffic reorganise itself. The slider creates load spikes.
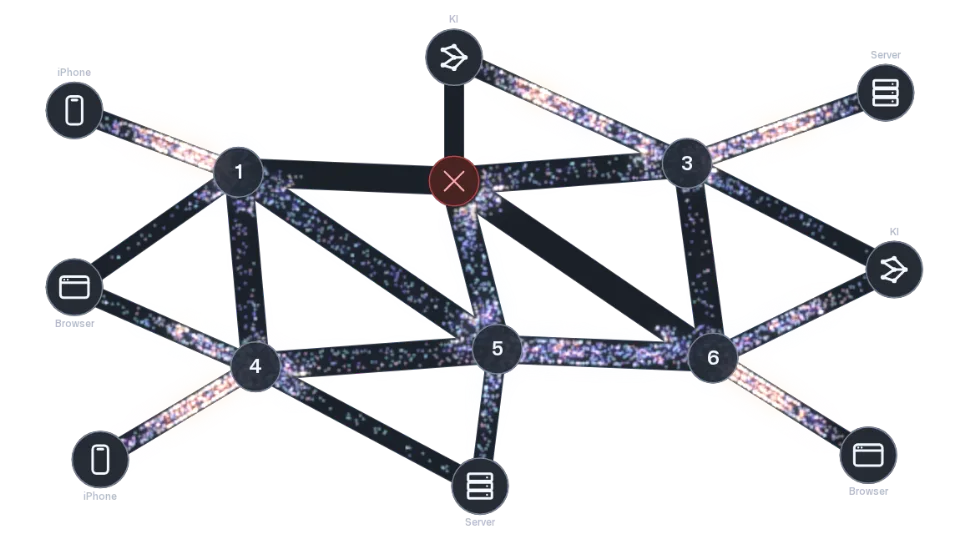
The live demo needs JavaScript and WebGL 2. The image shows the traffic in the network; the explanation below is readable without them.
- Packets
- –
- Deliveries/s
- –
- Mean latency
- –
- Down
- 0 / 9
- Frames/s
- –
- Simulation
- WebGL 2 · GPU
How it works
For every destination the graphics card keeps a distance field over the whole map: how far is it from here to there? It is built frame by frame in many small steps in which every cell takes over the best route of its neighbours, a discrete solution of the eikonal equation. A packet simply follows the slope of that field. Busy lines count as longer, so traffic spreads onto detours by itself. When a node fails it disappears from the map, the distances behind it rise, and within a few frames the slope points to the next free route.
The swarm behaviour comes from a density grid that is rebuilt from all packets every frame, a spatial hash on the GPU. From it each packet reads how crowded its surroundings are: in dense traffic it slows down, aligns its direction with its neighbours and moves towards emptier cells. Spots glowing red are jams; the heatmap underneath shows the load. The packets themselves live in two buffers on the graphics card that are read and written in turn with transform feedback. The GPU also counts the metrics, and the browser reads them back without waiting.